Contents
Introduction to Data Warehousing
Data Warehouse database and OLTP database
Defining OLAP Solutions and Data Warehouse design
Design of the data warehouse: Kimball Vs Inmon
Designing the Dimensional Model and Preparing the data for OLAP
Introduction to Data Warehousing
This tutorial starts with the introduction to Data Warehousing, Definition of OLAP, difference between Data warehouse and the OLTP Database, Objectives of data warehousing and data flow.
Computerization of business processes; technological advances in transmission and storage of data; and powerful database management tools have opened up new possibilities of data manipulation and analysis. Business managers are eager to explore the repositories of current and historical data to identify trends and patterns in the wrap and hoof of business. They hope to mine data and use them for taking intelligent business decisions. In this context, industries are increasingly focusing on data warehousing, Online Analytical Processing (OLAP), and other related technologies.
What's the Difference?
‘Data warehouse’ and ‘OLAP’ are terms which are often used interchangeably. Actually they refer to two different components of a decision support system. While data in a data warehouse is composed of the historical data of the organization stored for end user analysis, OLAP is a technology that enables a data warehouse to be used effectively for online analysis using complex analytical queries. The differences between OLAP and data warehouse is tabulated below for ease of understanding:
Data Warehouse
Data from different data sources is stored in a relational database for end use analysis
Data from different data sources is stored in a relational database for end use analysis Data is organized in summarized, aggregated, subject oriented, non volatile patterns.
Data is a data warehouse is consolidated, flexible collection of data Supports analysis of data but does not support online analysis of data.
Online Analytical Processing
A tool to evaluate and analyze the data in the data warehouse using analytical queries.
A tool which helps organizes data in the data warehouse using multidimensional models of data aggregation and summarization.
Supports the data analyst in real time and enables online analysis of data with speed and flexibility.
{mosgoogle)
What is Data Warehousing?
‘Data warehousing’ is a collection of decision support technologies that enable the knowledge worker, the statistician, the business manager and the executive in processing the information contained in a data warehouse meaningfully and make well informed decisions based on outputs.
The Data warehousing system includes backend tools for extracting, cleaning and loading data from Online Transaction Processing (OLTP) Databases and historical repositories of data. It also consists of the Data storage area--composed of the Data warehouse , the data marts and the Data store. It also provides for tools like OLAP for organizing, partitioning and summarizing data in the data warehouse and data marts and finally contains front end tools for mining, querying, reporting on data.
It is important to distinguish between a “Data warehouse” and “Data warehousing”.
A ‘Data warehouse’ is a component of the data warehousing system. It is a facility that provides for a consolidated, flexible and accessible collection of data for end user reporting and analysis.
A data warehouse has been defined by Inmom (considered one of the founders of the Data warehouse concept) as a “subject-oriented, integrated, time-varying, non-volatile collection of data that is primarily used in organizational decision making.”
- The data in a data warehouse is categorized on the basis of the subject area and hence it is “subject oriented”
- Universal naming conventions, measurements, classifications and so on used in the data warehouse, provide an enterprise consolidated view of data and therefore it is designated as integrated.
- The data once loaded can only be read. Users cannot make changes to the data and this makes it non-volatile.
- Finally data is stored for long periods of time quantified in years and bears a time and date stamp and therefore it is described as “time variant”.
Ralph Kimball the co-founder of the data warehousing concept has defined the data warehouse as a “"a copy of transaction data specifically structured for query and analysis”.
Both definitions highlight specific features of the data warehouse. The former definition focuses on the structure and organization of the data and the latter focuses upon the usage of the data. However, a listing of the features of a data warehouse would necessarily include the aspects highlighted in both these definitions.
Data Warehouse database and OLTP database
In this tutorial we will learn about the differences between Data Warehouse database and OLTP database and the objectives of a Data warehouse and Data flow.
The data warehouse and the OLTP data base are both relational databases. However, the objectives of both these databases are different.
The OLTP database records transactions in real time and aims to automate clerical data entry processes of a business entity. Addition, modification and deletion of data in the OLTP database is essential and the semantics of the application used in the front end impact on the organization of the data in the database.
The data warehouse on the other hand does not cater to real time operational requirements of the enterprise. It is more a storehouse of current and historical data and may also contain data extracted from external data sources.
The differences between these two relational databases, is tabulated below for information.
| Differences | |
| Data warehouse database | OLTP database |
| Designed for analysis of business measures by categories and attributes | Designed for real time business operations. |
| Optimized for bulk loads and large, complex, unpredictable queries that access many rows per table. | Optimized for a common set of transactions, usually adding or retrieving a single row at a time per table. |
| Loaded with consistent, valid data; requires no real time validation | Optimized for validation of incoming data during transactions; uses validation data tables. |
| Supports few concurrent users relative to OLTP | Supports thousands of concurrent users. |
However, the data warehouse supports OLTP system by providing a place for the latter to offload data as it accumulates and by providing services which would otherwise degrade the performance of the database.
Objectives of a Data warehouse and Data flow
The primary objective of data warehousing is to provide a consolidated, flexible meaningful data repository to the end user for reporting and analysis. All other objectives of Data warehousing are derived from this primary objective. The data flow in the warehouse also is determined by the objectives of data warehousing.
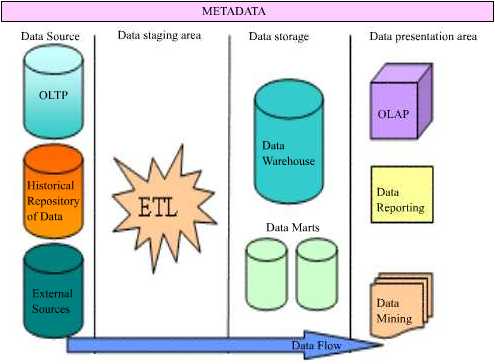
The data in a data warehouse is extracted from a variety of sources. OLTP databases, historical repositories and external data sources offload their data into the data warehouse. Achieving a constant and efficient connection to the data source is one of the objectives of data warehousing. This process is known as Data Source Interaction.
The data extracted from diverse sources will have to be checked for integrity and will have to be cleaned and then loaded into the warehouse for meaningful analysis. Therefore, harnessing efficient data cleaning and loading technologies (ETL—Extraction, Transformation and Loading) to the warehousing system will be another objective of the data warehouse. This process is known as Data Transformation service or Data preparation and staging.
The cleaned and stored data will have to be partitioned, summarized and stored for efficient query and analysis. Creating of subject oriented data marts, dimensional models of data and use of data mining technologies would follow, as the next objective of data warehousing. This process is called Data Storage.
Finally tools necessary for query, analysis and reporting on data would have to be built into the system to the process to deliver a rich end user experience. This process is known as Data Presentation.
Users need to understand what rules applied while cleaning and transforming data before storage. This information needs to be stored separately in a relational database called Metadata. Metadata is “data about data”. Mapping rules and the maps between the data sources and the warehouse; Translation, transformation and cleaning rules; date and time stamps, system of origin, type of filtering, matching; Pre-calculated or derived fields and rules thereof are all stored in this database. In addition the metadata database contains a description of the data in the data warehouse; the navigation paths and rules for browsing the data in the data warehouse; the data directory; the list of pre-designed and built in queries available to the users.
Defining OLAP Solutions and Data Warehouse design
This tutorial covers OLAP solutions used by Data warehouses and understanding Data Warehouse design. The enterprise needs to ask itself certain fundamental questions before actually launching on the process of designing the data warehouse. It must begin with a conviction that a data warehouse would really help its business and the return on investment will make it worth it.
Defining OLAP Solutions
The data warehouse offloads data from a multitude of sources. The cleaned, validated and loaded data is voluminous and daunting. This data needs to be organized, categorized and arranged in meaningful order for analytical purposes. OLAPsolutions are specifically designed to cater to this need.
OLAP solutions used by Data warehouses are:
Multidimensional views of data. Data in the data warehouse is organized into subject oriented categories and tables. Fact tables are constructed and linked to various dimensional tables in star or snowflake schemas or combinations of them to form multidimensional views of data. Cubes are built using these multidimensional schemas. Rapid browsing and querying then becomes possible. These views are independent of the way in which data is stored in thedata warehouse.
Interactive query and analysis of data is another OLAP solution that enables users drill down, drill up and slice data by using multiple passes. Users can drill down to successive lower levels of detail or roll up to higher levels of summarization and aggregation.
Analytical modeling is an OLAP tool that is a calculation engine for deriving ratios, variances etc., involving measurements and numerical data across many dimensions.
Functional models are made available by using OLAP for forecasting, trend analysis etc. They support users in data analysis.
Graphical OLAP tools are used to display data in 2D or 3D cross tabs and charts and graphs with easy pivoting of axis. This is important for users who need to analyze data from different perspectives and the analysis of one perspective leads to business questions that need to be examined from other perspectives.
Rapid response to queries is a must in any analysis of data and the measure of success for the OLAP tool. Nigel Pendse and Richard Creeth, authors of the OLAP Report developed the FASMI (Fast Analysis of Shared Multidimensional Information) test to judge whether or not an application qualifies to an OLAP tool. Their contention was that an OLAP tool should provide fast browsing capabilities (<>Multi dimensional data storage engine stores data in arrays. These arrays are logical representations of the business dimensions.
Understanding Data Warehouse design
At a very global level, construction of the data warehouse is a business project by itself. The enterprise needs to ask itself certain fundamental questions before actually launching on the process of designing the data warehouse. It must begin with a conviction that a data warehouse would really help its business and the return on investment will make it worth it.
The general questions that are asked may be as below….
- Do we need a data warehouse?
- How will it help the business?
- What will it mean in terms of cost?
- What are the current data analysis methodologies being adopted?
- In what way are they deficient?
- Will setting up the data warehouse help in reducing these deficiencies?
- What kind of reporting and analysis do we really want?
- What is that we are getting now?
- Will such data analysis make the business more efficient?
- Will it help the business improve its services and customer relations?
Once the replies to the above questions have been asked, the organization needs to examine other very crucial issues that will determine the wrap and hoof of thedata warehouse that is being set up.
- What are the kinds of data that are being generated by the enterprise?
- What kinds of data storage technologies are currently being used to backup and store historical data?
- What other external sources of information do we need to tap to make the data in the data warehouse meaningful for analysis?
- What kind of hardware and software will be required to set up this data warehouse?
- Who will be the personnel to handle the process of creating the data warehouse?
- Which departments will benefit from the data being created?
- Will the data warehouse be scaleable?
- How will it connect to the different data sources for data?
- How will we ensure that quality data is generated?
- What kinds of tools will be deployed to support end user needs for reports and analytics?
The answers that emerge from these questions will be a set of business requirements. These requirements will determine the kind of data warehouse that will be ultimately set up in the enterprise. The first steps would be to define the global parameters that will shape the design of the data warehouse. The design can be a top down approach as recommended by Bill Inmon or a bottom up approach recommended by Ralph Kimball. It can be a combination of the two called the Hybrid approach or it can be a federated approach. Let us have a brief look at what these different approaches mean.
This tutorial covers the basic design concepts, The top down approach, The Bottom-Up Approach , Hybrid Approach and Federated approach.
Ralph Kimball and Inmon, the co-founders of the data warehouse, significantly had their own differences in the design and architecture of the data warehouse. Inmon advocated a “dependent data mart structure” whereas Kimball advocated the “data warehouse bus structure”.
Design of the data warehouse: Kimball Vs Inmon
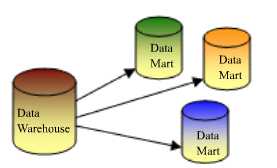
The Dependent Data Mart structure: The top down approach
Bill Inmon saw a need to transfer data from diverse OLTP systems into a centralized place where the data could be used for analysis. He insisted that data should be organized into subject oriented, integrated, non volatile and time variant structures. The data should be accessible at detailed atomic levels by drilling down or at summarized levels by drilling up. The data marts are treated as sub sets of the data warehouse. Each data mart is built for an individual department and is optimized for analysis needs of the particular department for which it is created.
The data flow in the top down OLAP environment begins with data extraction from the operational data sources. This data is loaded into the staging area and validated and consolidated for ensuring a level of accuracy and then transferred to the Operational Data Store (ODS). The ODS stage is sometimes skipped if it is a replication of the operational databases. Data is also loaded into the Data warehouse in a parallel process to avoid extracting it from the ODS. Detailed data is regularly extracted from the ODS and temporarily hosted in the staging area for aggregation, summarization and then extracted and loaded into the Data warehouse. The need to have an ODS is determined by the needs of the business. If there is a need for detailed data in the Data warehouse then, the existence of an ODS is considered justified. Else organizations may do away with the ODS altogether.
Once the Data warehouse aggregation and summarization processes are complete, the data mart refresh cycles will extract the data from the Data warehouse into the staging area and perform a new set of transformations on them. This will help organize the data in particular structures required by data marts. Then the data marts can be loaded with the data and the OLAP environment becomes available to the users.
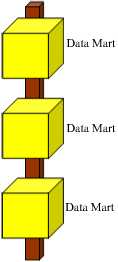
The Data warehouse Bus Structure: The Bottom-Up Approach
Ralph Kimball designed the data warehouse with the data marts connected to it with a bus structure. The bus structure contained all the common elements that are used by data marts such as conformed dimensions, measures etc defined for the enterprise as a whole. He felt that by using these conformed elements, users can query all data marts together. This architecture makes the data warehouse more of a virtual reality than a physical reality. All data marts could be located in one server or could be located on different servers across the enterprise while the data warehouse would be a virtual entity being nothing more than a sum total of all the data marts.
In this context even the cubes constructed by using OLAP tools could be considered as data marts. In both cases the shared dimensions can be used for the conformed dimensions.

This model strikes a good balance between centralized and localized flexibility. Data marts can be delivered more quickly and shared data structures along the bus eliminate the repeated effort expended when building multiple data marts in a non-architected structure. The conformed dimensions along the bus fit very well with the shared dimension and virtual cube capabilities of Microsoft’s OLAP services.
The bottom-up approach reverses the positions of the Data warehouse and the Data marts. Data marts are directly loaded with the data from the operational systems through the staging area. The ODS may or may not exist depending on the business requirements. However, this approach increases the complexity of process coordination. The standard procedure where data marts are refreshed from the ODS and not from the operational databases ensures data consolidation and hence it is generally recommended approach.
The data flow in the bottom up approach starts with extraction of data from operational databases into the staging area where it is processed and consolidated and then loaded into the ODS. The data in the ODS is appended to or replaced by the fresh data being loaded. After the ODS is refreshed the current data is once again extracted into the staging area and processed to fit into the Data mart structure. The data from the Data Mart then is extracted to the staging area aggregated, summarized and so on and loaded into the Data Warehouse and made available to the end user for analysis.
Hybrid Approach
The Hybrid approach aims to harness the speed and user orientation of the Bottom up approach to the integration of the top-down approach. The Hybrid approach begins with an Entity Relationship diagram of the data marts and a gradual extension of the data marts to extend the enterprise model in a consistent, linear fashion. These data marts are developed using the star schema or dimensional models. The Extract, Transform and Load (ETL) tool is deployed to extract data from the source into a non persistent staging area and then into dimensional data marts that contain both atomic and summary data. The data from the various data marts are then transferred to the data warehouse and query tools are reprogrammed to request summary data from the marts and atomic data from the data warehouse.
Federated approach
This is a hub-and –spoke architecture often described as the “architecture of architectures. It recommends an integration of heterogeneous data warehouses, data marts and packaged applications that already exist in the enterprise. The goal is to integrate existing analytic structures wherever possible and to define the “highest value” metrics, dimensions and measures and share and reuse them within existing analytic structures. This may result in the creation of a common staging area to eliminate redundant data feeds or building of a data warehouse that sources data from multiple data marts, data warehouses or analytic applications. Hackney-a vocal proponent of this architecture—claims that it is not an elegant architecture but it is an architecture that is in keeping with the political and implementation reality of the enterprise
Designing the Dimensional Model and Preparing the data for OLAP
This tutorial covers Designing the Dimensional Model, Dimensional Model schemas like Star Schema, Snowflake Schema, Optimizing star schema and Design of the Relational Database, OLAP Cubes and Data mining tools, Security considerations, metadata and backup and recovery plans.
Preparing the data for OLAP
The global issues out of the way, the enterprise must begin to focus on the granular design issues. The data in the data warehouse must be prepared for the application of Online Analytical Processing (OLAP) solutions and such preparations will be driven by the business needs of the enterprise.
Designing the Dimensional Model
User requirements and data realities drive the design of the dimensional model. The grain of detail and the type of facts to be included are decided by the business needs and the type of analytics and reports the end user wishes to generate. Maintenance issues and scalability issues determine the type of model created.
Central to the dimensional model are the Dimension tables which are linked to Fact tables. Dimension tables are tables which encapsulate the attributes associated with a particular subject into a table. A dimension table may relate to a customer, a product or a geographical region. Dimension tables have three kinds of fields—a primary key field, hierarchy level field and attribute fields. Dimension tables are linked to fact tables using the primary key of the dimension table and the foreign key of the fact table. Dimension tables are relatively small tables compared to fact tables. A dimension table may be used in multiple places if the data warehouse contains multiple fact tables that link to the dimension table. Such tables are known as Conforming dimensions. Use of conforming dimensions is critical to the design of the data warehouse.
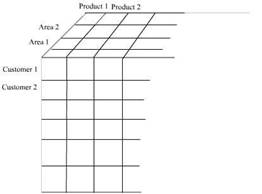
Dimension tables define a dimension. A dimension is hierarchical and the nature of the hierarchy is determined by the needs of the group requiring the dimension. For example the time dimension may contain the day, week, month, year and quarter as attributes. A two dimension hierarchy may have customer and area as a dimension.
A dimension may also contain multiple hierarchies. For instance a time dimension may contain a calendar year and a fiscal year as hierarchies. A multiple hierarchy dimension in the customer dimension table would be area dimension, customer dimension and product dimension. This will be represented as a three dimensional model of data. This figure represents a three dimensional hierarchy
As a safety measure most dimension tables provide for an omnibus attribute called “all” such as “all customers”, “all products”. This is an artificial
category used for grouping the first level category of the dimension and permits summarization of fact data to a single number for a dimension. A hierarchy may be balanced, unbalanced, ragged, or composed of parent child relationships. We will be dealing with these attributes later in the series.
Surrogate keys are keys defined and maintained in the data warehouse to uniquely identify records in the dimension. GUID(globally unique numbers) and Identity keys are sometimes used in data derived from distributed sources to identify them.
Fact Tables
A fact table contains business event details and addresses unique business problems, process and user needs. Fact tables are very large containing millions of rows and consuming hundreds of gigabytes of space. Since dimension tables contain descriptions of facts, the fact table can be reduced to columns for dimension foreign keys and numeric fact values.
Data warehouses may contain multiple fact tables. Each fact table may relate to one particular user requirement or business need. The fact tables are related to the dimension tables relating to the business function in schemas known as star or snowflake schemas. Such business specific schemas may be part of the central data warehouse or implemented in separate data marts.
Very large fact tables are partitioned physically for ease of implementation and design considerations. The partitions are usually on a single dimension-mostly time dimension as the data in the data warehouse is historical in nature. The OLAP cubes that are developed using the partitioned fact tables are also partitioned to match the partition in the fact table.
Measures are values that quantify facts and are numeric. Measures are usually additive along dimensions. For example Quantity by customer, product and time results in a meaningful value. However non-additive values also can exist along dimensions. The quantity on hand measure is a non-additive value. Calculated measures are measures that result from applying a function to one or more measures. An example of this measure is the result of a multiplying price with product quantity.
The logical model of a fact table contains a foreign key column for the primary keys of each dimension. The combination of these foreign keys defines the primary key for the fact table. The type of composite key defined will be determined by the type of partitions required, the load performance needed etc.
The fact table resolves many-to-many relationships between dimensions because the dimension tables join through the fact table.
The granularity of the fact table is determined by the fact content columns that have been identified. Granularity is the measure of the level of detail addressed by the individual entries in the fact table.
Design of the Dimensional Model schemas
The primary characteristic of a dimensional model is set of dimension tables connected to a fact table through the foreign keys in the fact table and the primary keys in the dimension tables. The fact table and the dimension tables in a database can be linked directly or indirectly. When multiple dimension tables are linked to a fact table a Star Schema is formed. When some tables are linked directly to a fact table while others are linked indirectly by linking to the linked dimension table a Snowflake Schema is realized.
The Star Schema
The star schema is created when all the dimension tables directly link to the fact table. This is graphically represented as under.
The star schema dimensional model.
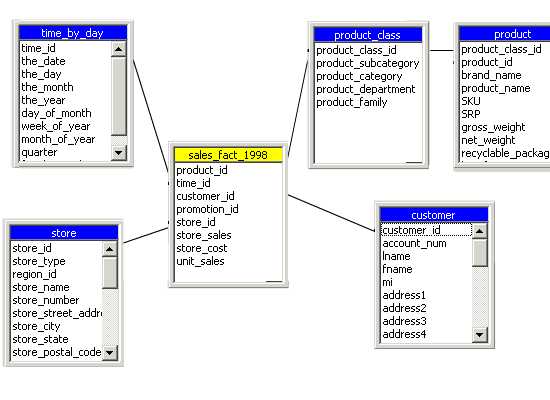
Since the graphical representation resembles a star it is called a star schema. It must be noted that the foreign keys in the fact table link to the primary key ofthe dimension table. This sample provides the star schema for a sales_ fact for the year 1998. The dimensions created are Store, Customer, Product_class and time_by_day. The Product table links to the product_class table through the primary key and indirectly to the fact table. The fact table contains foreign keys that link to the dimension tables.
The Snowflake Schema
The snowflake schema is a schema in which the fact table is indirectly linked to a number of dimension tables. The dimension tables are normalized to remove redundant data and partitioned into a number of dimension tables for ease of maintenance. An example of the snowflake schema is the splitting of the Product dimension into the product_category dimension and product_manufacturer dimension..
|
|
|
Snowflake schemas usually co-exist with the star schema. The figure below gives a combination of the star schema and the snowflake schema.
Optimizing star schema
Sometimes the star schema is optimized by combining all the dimension tables into a single table. The resultant table is known as a Cartesian product. The optimized star table consists of the fact table and the combined dimension tables . The advantage of this combination is that the queries do not have to perform join operations. The only join operation would be between the fact table and the combined dimension table.
Scalability of the Dimension model
Data warehouse structures must be designed to accommodate current and future business needs of the enterprise. It must be scalable enough to accommodate additional demands with minimum of change to the fundamental design of the warehouse. Dimensional modeling has the advantage of being saleable. It can be expanded by addition of records to dimension tables. New dimensions and schemas can be added with ease. Existing dimensions can be used with the new dimensions without modification to maintain conformity throughout the entire warehouse. If granularity is to be added, dimension tables can be partitioned to granular levels for drilling down operations on the data. OLAP cubes can be extended to accommodate new dimensions by extending their schemas and reprocessing or creating new virtual cubes that contain new dimensions. Existing cubes can be incorporated without modification
Design of the Relational Database and OLAP Cubes and Data mining tools
The next phase in the data warehouse design is the design of the relational database and the OLAP cubes. With this the design phase moves into a more granular level of designing surrogate keys, primary and foreign key relationships, Views, indexes, partitions of fact tables. OLAP cubes are created to support the query needs of end users.
Dimension tables are indexed on their primary key. These are generally surrogate keys created in the data warehouse tables. The fact table must have a unique index on the primary key. Indexes on primary keys can be clustered or non clustered depending on the volume of schemas being maintained in the data warehouse.
Views are created for users who need direct access to data in the data warehouse relational database. Indexed views are used to improve performance of user queries that access data through views. View definitions create column and table names that make sense to the end user.
The applications that support data analysis are constructed in this phase of the design. OLAP cubes design requirements are then defined by the parameters set in the dimensional model of the data warehouse. Cubes provide fast access to data in a data warehouse . A cube has been defined as a multidimensional data structure with defined dimensions and measures and constructed out of a subset of data of the data warehouse.
Though data mining does not determine the wrap and hoof of the data warehouse design, data mining is the final manifestation of the data warehouse. Data mining uses sophisticated algorithms to analyze data and create models that represent information about the data. Data mining models are used to predict characteristics of new data or to identify groups of data entities.
Metadata:
The data warehouse reflects the business model of the enterprise and therefore an essential element of data warehousing design is the creation and management of metadata. Metadata is data about data. Many different kinds of metadata are to be created and managed. Administrative metadata includes the information necessary for setting up and using the warehouse. Business metadata includes business terms and definitions, ownership details and changing policy details. Operational metadata stores information that is collected during the operation of the warehouse such as the lineage of migrated and transformed data, the currency of data etc.
Security considerations and backup and recovery plans
It is important to build in adequate security measures into the data warehouse system. The organizations security policy will impact on who can access or view data. Security policies will demand the creation of multiple copies of the data or creation of data views and possible classification of data on basis of security codes.
Closely allied to the security considerations is the backup and disaster recovery plans for the data warehouse.
The key to successful data warehousing is data design as defined by end users. Business users know what they want and they focus upon it. They will determine what data will be needed, where to locate it, how it can harnessed, what dimensions are to be created and what output is expected. The remaining tasks are a natural outcome of the business needs. Therefore, the best data warehouse design naturally and gracefully flows out of the business requirements of the end user.
Understanding OLAP Models
This tutorial covers the different types of OLAP models like Relational Online Analytical Processing mode( ROLAP), Multidimensional Online Analytical processing mode(MOLAP) and Hybrid Online Analytical Processing mode or HOLAP.
Cubes in a data warehouse are stored in three different modes. A relational storage model is called Relational Online Analytical Processing mode or ROLAP, while a Multidimensional Online Analytical processing mode is called MOLAP. When dimensions are stored in a combination of the two modes then it is known as Hybrid Online Analytical Processing mode or HOLAP.
MOLAP
This is the traditional mode in OLAP analysis. In MOLAP data is stored in form of multidimensional cubes and not in relational databases. The advantages of this mode is that it provides excellent query performance and the cubes are built for fast data retrieval. All calculations are pre-generated when the cube is created and can be easily applied while querying data. The disadvantages of this model are that it can handle only a limited amount of data. Since all calculations have been pre-built when the cube was created, the cube cannot be derived from a large volume of data. This deficiency can be bypassed by including only summary level calculations while constructing the cube. This model also requires huge additional investment as cube technology is proprietary and the knowledge base may not exist in the organization.
ROLAP
The underlying data in this model is stored in relational databases. Since the data is stored in relational databases this model gives the appearance of traditional OLAP’s slicing and dicing functionality. The advantage of this model is it can handle a large amount of data and can leverage all the functionalities of the relational database. The disadvantages are that the performance is slow and each ROLAP report is an SQL query with all the limitations of the genre. It is also limited by SQL functionalities. ROLAP vendors have tried to mitigate this problem by building into the tool out-of-the-box complex functions as well as providing the users with an ability to define their own functions.
HOLAP
HOLAP technology tries to combine the strengths of the above two models. For summary type information HOLAP leverages cube technology and for drilling down into details it uses the ROLAP model.
Comparing the use of MOLAP, HOLAP and ROLAP
The type of storage medium impacts on cube processing time, cube storage and cube browsing speed. Some of the factors that affect MOLAP storage are:
Cube browsing is the fastest when using MOLAP. This is so even in cases where no aggregations have been done. The data is stored in a compressed multidimensional format and can be accessed quickly than in the relational database. Browsing is very slow in ROLAP about the same in HOLAP. Processing time is slower in ROLAP, especially at higher levels of aggregation.
MOLAP storage takes up more space than HOLAP as data is copied and at very low levels of aggregation it takes up more room than ROLAP. ROLAP takes almost no storage space as data is not duplicated. However ROALP aggregations take up more space than MOLAP or HOLAP aggregations.
All data is stored in the cube in MOLAP and data can be viewed even when the original data source is not available. In ROLAP data cannot be viewed unless connected to the data source.
MOLAP can handle very limited data only as all data is stored in the cube.
Applying OLAP Cubes
This tutorial covers the types of changes that impact on cubes and Synchronization OLAP and data warehouse data.
Multidimensional cubes are created out of the data stored in the data warehouse. Numerical measures are also summarized into pre-aggregated values when cubes are constructed. These cubes are then stored in multidimensional structures that are designed for rapid query. The pre-aggregated information is combined with raw fact data to respond to a wide variety of queries.
Types of changes that impact on cubes
Since cubes contain summarized data from the data warehouse, any changes to the data in the warehouse also affects the integrity and accuracy cubes which have been created from such data. Therefore, synchronization of data in the data warehouse and in the cubes becomes very important. OLAP data must be updated after the data in the data warehouse has been modified. Cubes, dimensions and partitions must be processed to incorporate the new or changed data. The method of processing the OLAP object depends on the kind of change that has been effected to the warehouse.
The most common type of changes to the data in the data warehouse is addition of current data to the data warehouse. Modifications of original data or change in the design of the warehouse are seldom attempted. Such additions of data will impact on cube definitions available to client applications. The impact of such additions is usually managed by carefully defining partition filters and by designing a strategy to synchronize OLAP anddata warehouse data.
Changes to the data warehouse can also be made to correct errors in the data. This is usually minimized and taken care of during data transformation, scrubbing and validation operations. Changes may also occur due to changes in the structure of the organization or its products. Such changes will be incorporated into the OLTP database and then transferred to the data warehouse while migrating the data from the former to the latter. Cubes can accommodate and absorb the changes that correct value errors, but changes that move a fact table form one dimension member to another will adversely affect the integrity of the results derived from processing the cube. The data loaded into the cube will have to be refreshed by reprocessing the cube and recalculating the aggregations. The reprocessing of the cube can be done by selecting Full process or Refresh data processing options. If the aggregations remain the same the refresh data processing option will be faster.
Dimension hierarchies can also be affected by changes in the data in the data warehouse dimension tables even when the table schema remains the same. The dimension hierarchy depends on the relationships between the members of the dimension table. When the relationships change the dimension structure must be rebuilt.
Synchronization OLAP and Data Warehouse data
Valid cubes are made available to client applications. Since these cubes interact with the data in the data warehouse, a synchronization strategy must be put in place while designing the data warehouse. The strategy should provide for addition of data to the warehouse without causing data distortion and wrong reporting on queries by cubes.
Real time cubes are used to automatically update the data in the cubes, when the data in the warehouse has been updated. This is generally used when live data needs to be analyzed. They extend OLAP capabilities and do not replace the traditional cube designs and applications.
One strategy for managing additions to the data warehouse and OLAP data is the design of a batch update system. In this strategy, a batch number is assigned to all the data records in the fact table. When the cube is designed and a filter expression is added for each of the cubes partitions to specify the largest batch number. Any additions to the fact table subsequently will include a newer and higher batch number. Cubes then, become unaffected by the addition of new records as cubes are restricted to reading data only from the earlier batches. A batch number in a Dimension table will be useful in ensuring referential integrity.
Dimensions and cubes or partitions are to be processed to incorporate new data after a batch of data has been added to the fact table and the dimension tables. Shared dimensions are to be processed before cubes use them. The Incremental update option can be used to update the additions to a dimension if the structure of the dimension is not affected. However, the new members will be displayed but the cells associated with those members will remain empty till the cube is updated with new data from the fact table that relates to the new members. Use of the Rebuild the dimension structure option makes all the cubes that incorporate the dimension unavailable to the client applications.
The new data can be incorporated into the cube by updating the filter expression in each of the cube’s partitions to include the new batch number. The cube has to then be processed or incrementally updated. If the cube’s data is divided by multiple partitions, one of the partitions can be used to accumulate the data batches and that partition alone can be processed. Other partitions can be equipped with filters to prevent fresh data from being added to them.
When a cube is being deployed by a client application and the cube is being processed, the cube remains online till the processing is complete. Once the processing is complete the refreshed cube is displayed to the client application. This is true when the cube is processed with the Incremental update option or the Refresh data option. During full process the client application will be disconnected from the cube and must reconnect to the new cube after the process is complete.
The challenge is to manage changes to data warehouse data effectively and to ensure that such changes, are reflected, in the cubes in real time. The challenges are many and varied and it is important to make the right trade-offs along the way.
1 comment:
Nice and good article. It is very useful for me to learn and understand easily. Thanks for sharing your valuable information and time. Please keep updatingmicrostrategy online training
Post a Comment